Pimoroni Flotilla – first impressions

Flotilla comes into home port!

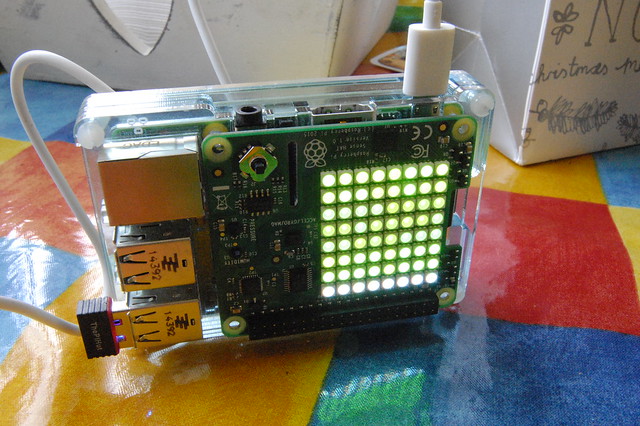
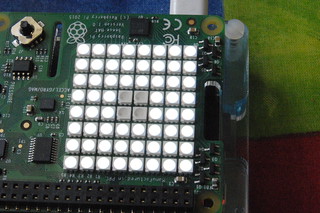
Hot on the heels of my official Raspberry Pi SenseHAT, Mr Postman brought me the Pimoroni Flotilla. I got this early because I backed it on Kickstarter, ooh quite a long time ago now, and I’d almost forgotten about it. A very welcome early Christmas present from the crew at Sheffield’s Pimoroni.

Flotilla is billed as ‘friendly electronics’ – modular sensors and LED output devices you plug into your Raspberry Pi, with no soldering required. As such, you might think there’s an overlap with the SenseHAT, but they are very different. The SenseHAT is self-contained, it plugs directly onto the pins on your Pi and you program it in Python. Flotilla, on the other hand, is anything but self-contained:

Setting sail with Flotilla

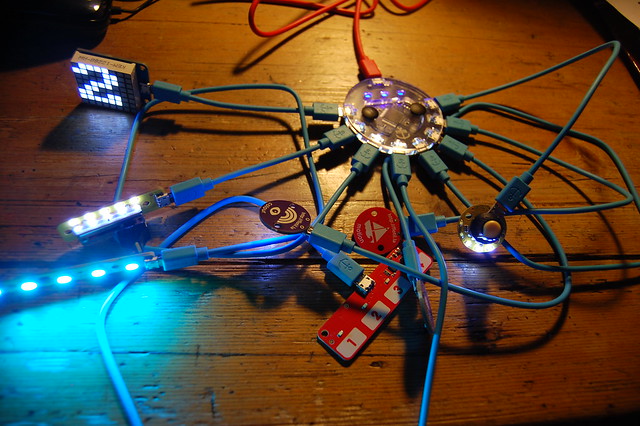
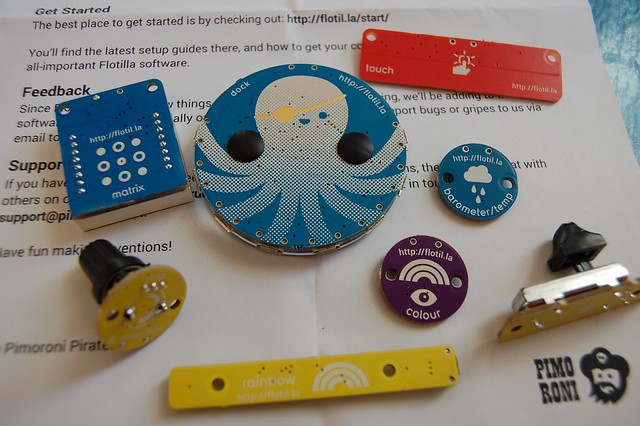
The heart of it is the ‘dock’ – a round device that plugs into the Pi’s USB port. It has 8 sockets to plug in ‘tentacles’ which you attach input and output devices to. The attention to detail on these is amazing – the blue leads have little anchors embossed on the plugs, and as is the way with Pimoroni, the graphics are beautiful in a very Sheffield-ish kind of way:

Flotilla comes into home port!

Once a studio manager, always a studio manager – so rather than reading any instructions I just plugged it all in and played with it to try to figure out what it would do. You program it using a web interface called ‘Rockpool’:

Programming Flotilla

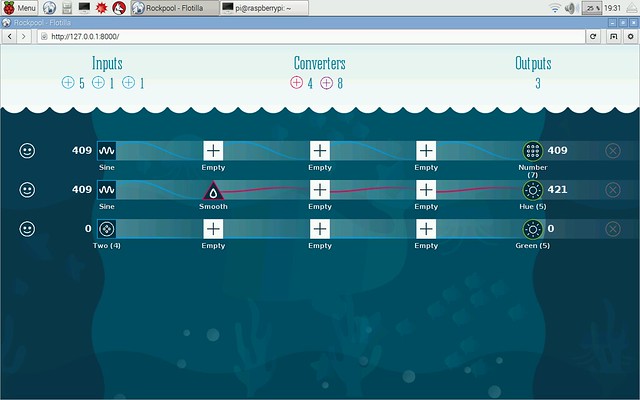
You click on inputs, which can be physical devices or patterns like a sine wave or saw-tooth wave, do stuff in the middle, and then pipe things to output devices on the right.

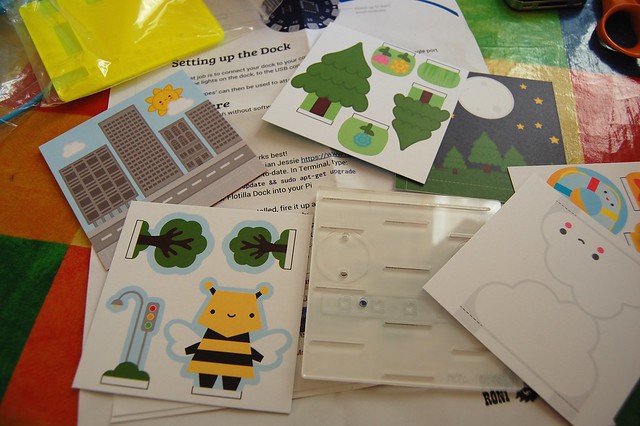
I can see Flotilla appealing very much to younger children, and I will save the diorama cut-out cards supplied for my KS2 computer club next term, to see what they make of it – I think my own children are probably too old for this.

Flotilla comes into home port!

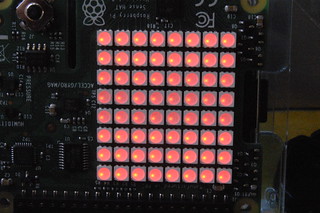
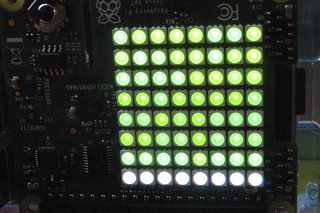
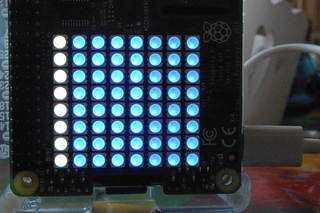
Here’s a very simple project I knocked up in a couple of minutes, using the colour sensor to detect and mimic colours on my patchwork Elmer tablecloth. I piped the red input to the red output on the led strip, green to green and blue to blue:

colour detector

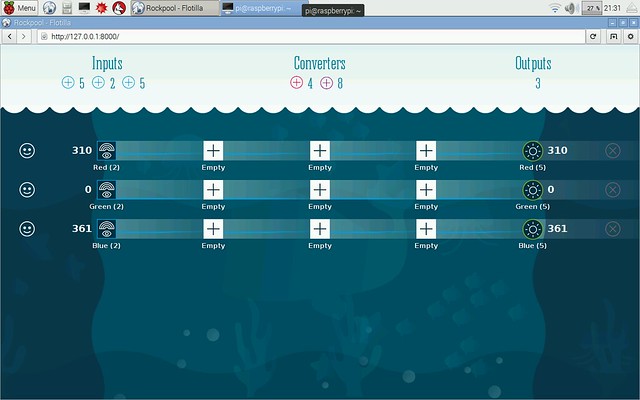
And here’s the result:

I’ve only scratched the surface with Flotilla – it’s clearly got lots of potential and I like the way you can get a simple project running in seconds with the scope to build much more complex and sophisticated projects later on.

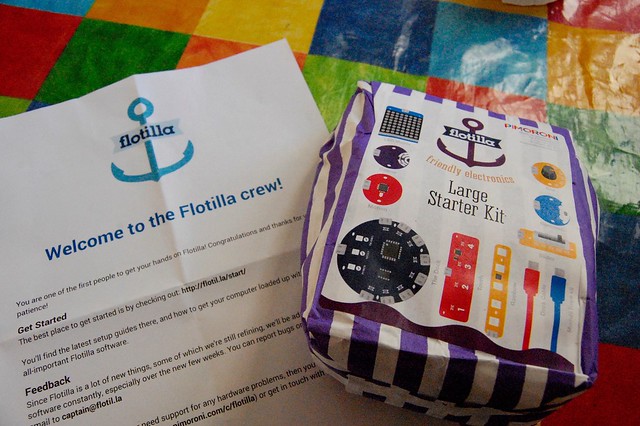
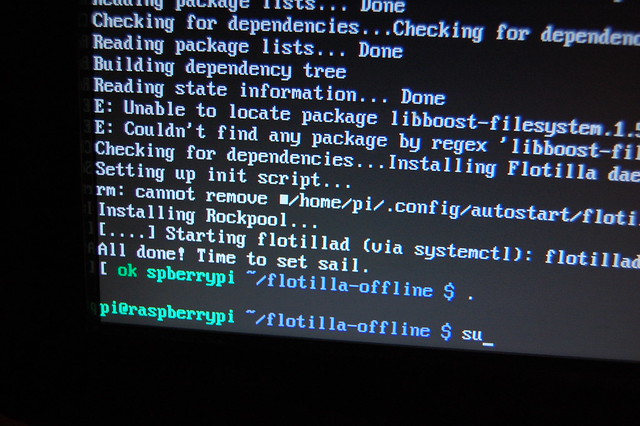
My ‘large starter kit’ came with an RGB LED colour strip and an 8×8 text/numerical LED matrix display as output devices, and lots of input devices: a 4 button touch pad, a rotary dial, a linear fader, a thermometer/baromoter, a motion sensor, and a colour sensor – plus blue leads, or ‘rope’, to attach them all to the dock. Installation of the software was quick and easy and included a nice touch in the command line:

time to set sail!

I look forward to many adventures aboard my Flotilla, and seeing what projects other folk (especially kids) come up with. Children always have the best ideas when you give them creative toys like this (and I don’t use the word ‘toys’ in a negative way at all – play is good!).

(Pirate) hats off to the Pimoroni team!

Posted in computers, education, ICT, Linux, Raspberry Pi, Raspbian | Tagged , , | 3 Comments

Raspberry Pi news ticker

Here’s an updated version of my weather ticker – this one gives you the BBC news headlines too!

It uses a SenseHAT plug-in board atop a RaspberryPi – no soldering required, just install the SenseHAT and feedparser (‘sudo pip install feedparser’) Python libraries on your freshly-updated install of Raspbian, and you are good to go. Feedparser makes extracting useful information from the XML in RSS feeds a doddle.

It gives you 7 headlines (though you can easily have more or fewer), all colour-coded in rainbow colours so you can get a sense which story is most important without watching the whole feed – red comes first, followed by orange, yellow, green etc. You could also tweak the RSS feed to give you regional or subject-based news feeds.

Here’s the simple Python code. If you want to make it run at boot, scroll to the end:

import feedparser
from sense_hat import SenseHat
import re

sense = SenseHat()
colours = [[255,0,0],[255,165,0],[255,255,0],[0,255,0],[0,0,255],[75,0,130],[238,130,238]]

def fetch_weather():
    w = feedparser.parse('http://open.live.bbc.co.uk/weather/feeds/en/bs1/3dayforecast.rss')
    return(w)

def fetch_news():
    n = feedparser.parse('http://feeds.bbci.co.uk/news/rss.xml')
    return(n)

d = fetch_weather()
entries = int(len(d['entries']))
news = fetch_news()

counter = 0

while True:
    counter = counter + 1
    for y in range(7):
        headline = (news['entries'][y]['title'])
        displayhead = str(y+1)+'.'+headline+' |'
        sense.show_message(displayhead, text_colour=colours[y])
    for x in range(entries):
        wx = (d['entries'][x]['title'])
        disp_wx = wx.replace(u"\u00B0",'')
        disp_wx = disp_wx.replace('Maximum Temperature','High')
        disp_wx = disp_wx.replace('Minimum Temperature','Low')
        disp_wx = re.sub(r'\([^)]*\)', '', disp_wx)
        sense.show_message(disp_wx, text_colour=colours[x])
    if counter == 10:
        d = fetch_weather()
        news = fetch_news()
        entries = int(len(d['entries']))
        sense.show_message('UPDATING', text_colour=[255,0,0])
        counter = 0

So, you want your news & weather ticker to run automatically at boot? Here’s what to do. First run raspi-config, and under ‘boot options’, pick the option to get your Pi to autologin to the text console as the ‘pi’ user. Then reboot and type
sudo nano /etc/profile
at the command line. Add this line at the end and press ctrl-X to exit and save:
sudo python /home/pi/news.py
(assuming you called your script news.py and saved it in that folder). This should now run the script as soon as the ‘pi’ user logs in.

There’s a problem, though. Your script may run before your RaspberryPi has connected to the internet, especially over wifi. So here’s a new version of the script with a new function haz_internet() – this tests for internet access by talking to google.co.uk before continuing the script. (I should probably rejig it so it copes with losing internet access as well.)

Now as soon as your Pi gets power & internet, it will display headlines and weather. Be careful if you ssh in to your Pi, though – it will run another version of the program, making the display go nuts. Crash out of the second copy by pressing ctrl-C. Next step: a graceful shutdown and possibly IP address display using the joystick. Ah. The joystick…

import feedparser
from sense_hat import SenseHat
import re
import socket

# function to test for internet access
REMOTE_SERVER = "www.google.co.uk"
def haz_internet():
  try:
    host = socket.gethostbyname(REMOTE_SERVER)
    s = socket.create_connection((host, 80), 2)
    return True
  except:
     pass
  return False

sense = SenseHat()
colours = [[255,0,0],[255,165,0],[255,255,0],[0,255,0],[0,0,255],[75,0,130],[238,130,238]]

def fetch_weather():
    w = feedparser.parse('http://open.live.bbc.co.uk/weather/feeds/en/bs1/3dayforecast.rss')
    return(w)

def fetch_news():
    n = feedparser.parse('http://feeds.bbci.co.uk/news/rss.xml')
    return(n)

while not haz_internet():
    sense.show_message('waiting for internet')

d = fetch_weather()
entries = int(len(d['entries']))
news = fetch_news()

counter = 0

while True:
    counter = counter + 1
    for y in range(7):
        headline = (news['entries'][y]['title'])
        displayhead = str(y+1)+'.'+headline+' |'
        sense.show_message(displayhead, text_colour=colours[y])
    for x in range(entries):
        wx = (d['entries'][x]['title'])
        disp_wx = wx.replace(u"\u00B0",'')
        disp_wx = disp_wx.replace('Maximum Temperature','High')
        disp_wx = disp_wx.replace('Minimum Temperature','Low')
        disp_wx = re.sub(r'\([^)]*\)', '', disp_wx)
        sense.show_message(disp_wx, text_colour=colours[x])
    if counter == 10:
        d = fetch_weather()
        news = fetch_news()
        entries = int(len(d['entries']))
        sense.show_message('UPDATING', text_colour=[255,0,0])
        counter = 0
Posted in Raspberry Pi | Tagged , , , | Leave a comment

SenseHAT weather forecaster

Here’s a really simple scrolling weather forecast for the RaspberryPi SenseHAT.

It uses the BBC Weather RSS feed, so you would replace the postcode (‘bs1′) with your own to get your local forecast.

You’ll also need to install feedparser – this is very easy. Just type
sudo pip install feedparser
on the Raspberry Pi command line, and you should be good to go. Obviously, your Pi needs to be connected to the internet for this to work.

Here’s the simplest possible version of the Python code to display a 3 day forecast in rolling text:

import feedparser
from sense_hat import SenseHat

sense = SenseHat()

d = feedparser.parse('http://open.live.bbc.co.uk/weather/feeds/en/sw1/3dayforecast.rss')
entries = int(len(d['entries']))
for x in range(entries):
    sense.show_message(d['entries'][x]['title'])

This reads the RSS feed’s XML into an array called ‘d’. It then counts how many forecasts there are – I guess there will always be 3, but seeing as it’s easy to count them, let’s count them anyway. It then loops 3 times showing the forecast for that day, which is stored in the ‘title’ block of the XML.

A few possible improvements spring to mind.

It’s quite a long scrolling message, so let’s add different colours for each day of the week, so when you glance at it you know if it’s today’s weather (white text), tomorrow’s (green) or the day after tomorrow (blue):

import feedparser
from sense_hat import SenseHat

sense = SenseHat()
colours = [[255,255,255],[0,255,0],[0,0,255]]

print colours

d = feedparser.parse('http://open.live.bbc.co.uk/weather/feeds/en/bs1/3dayforecast.rss')
entries = int(len(d['entries']))
for x in range(entries):
    sense.show_message(d['entries'][x]['title'], text_colour=colours[x])

(If you did have more than 3 entries in a 3-day forecast, the code would break – you’d need to add more colours).

Now I see the SenseHAT can’t display degree signs, it shows a question mark instead, so let’s strip them out:

import feedparser
from sense_hat import SenseHat

sense = SenseHat()
colours = [[255,255,255],[0,255,0],[0,0,255]]

d = feedparser.parse('http://open.live.bbc.co.uk/weather/feeds/en/bs1/3dayforecast.rss')
entries = int(len(d['entries']))
for x in range(entries):
    wx = (d['entries'][x]['title'])
    disp_wx = wx.replace(u"\u00B0",'')
    sense.show_message(disp_wx, text_colour=colours[x])

I’ve used \u00B0 as this is the escape sequence for a degree symbol, and I replace this with nothing, though you could replace it with the word ‘degrees’.

So far, this only runs once, so let’s get the program to keep running. Because we are responsible digital citizens, we won’t keep requesting the weather forecast every few seconds, we’ll ask for it once when we start the program running, and then keep the text scrolling by adding a while True statement:

import feedparser
from sense_hat import SenseHat

sense = SenseHat()
colours = [[255,255,255],[0,255,0],[0,0,255]]

d = feedparser.parse('http://open.live.bbc.co.uk/weather/feeds/en/bs1/3dayforecast.rss')
entries = int(len(d['entries']))

while True:
    for x in range(entries):
        wx = (d['entries'][x]['title'])
        disp_wx = wx.replace(u"\u00B0",'')
        sense.show_message(disp_wx, text_colour=colours[x])

Next I notice that ‘maximum/minimum temperature’ is a bit of a screenful, so let’s change that to ‘high’ or ‘low’:

import feedparser
from sense_hat import SenseHat

sense = SenseHat()
colours = [[255,255,255],[0,255,0],[0,0,255]]

d = feedparser.parse('http://open.live.bbc.co.uk/weather/feeds/en/bs1/3dayforecast.rss')
entries = int(len(d['entries']))

while True:
    for x in range(entries):
        wx = (d['entries'][x]['title'])
        disp_wx = wx.replace(u"\u00B0",'')
        disp_wx = disp_wx.replace('Maximum Temperature','High')
        disp_wx = disp_wx.replace('Minimum Temperature','Low')
        sense.show_message(disp_wx, text_colour=colours[x])

Finally, this version strips out the Fahrenheit and gets a fresh forecast after displaying the 3 day forecast 10 times:

import feedparser
from sense_hat import SenseHat
import re

sense = SenseHat()
colours = [[255,255,255],[0,255,0],[0,0,255]]

def fetch_weather():
    w = feedparser.parse('http://open.live.bbc.co.uk/weather/feeds/en/bs1/3dayforecast.rss')
    return(w)

d = fetch_weather()
entries = int(len(d['entries']))

counter = 0

while True:
    counter = counter + 1
    for x in range(entries):
        wx = (d['entries'][x]['title'])
        disp_wx = wx.replace(u"\u00B0",'')
        disp_wx = disp_wx.replace('Maximum Temperature','High')
        disp_wx = disp_wx.replace('Minimum Temperature','Low')
        disp_wx = re.sub(r'\([^)]*\)', '', disp_wx)
        sense.show_message(disp_wx, text_colour=colours[x])
    if counter == 10:
        d = fetch_weather()
        entries = int(len(d['entries']))
        sense.show_message('UPDATING', text_colour=[255,0,0])
        counter = 0

A nice extension would be to display symbols based on the weather, or perhaps change text colour depending on the temperature – red if it’s warm, blue if it’s cold? The sky (ahem) is the limit…

Posted in Raspberry Pi | Tagged , , | 15 Comments

RaspberryPi dice project

Here’s a simple dice (ok, die) project for the Raspberry Pi SenseHAT – it senses a shake by measuring the G-force on the accelerometer. If the G-force goes above 1.4, it generates a random number between 1 and 6 and displays a dice (die) pattern. I chose 1.4 so it’s not too sensitive – you have to give it a decent shake, and I put in a small sleep statement so it doesn’t do multiple rolls in one go.

It’s inspired by this BBC Microbit project – but then I’m still waiting for my own Microbit…

Here’s the Python code:

from sense_hat import SenseHat
import time
import random

sense = SenseHat()

sense.clear()

sense.show_message("Shake to roll!")

b = [0, 0, 0]
g = [0, 255, 0]
r = [255, 0, 0]

one = [
b,b,b,b,b,b,b,b,
b,b,b,b,b,b,b,b,
b,b,b,b,b,b,b,b,
b,b,b,g,g,b,b,b,
b,b,b,g,g,b,b,b,
b,b,b,b,b,b,b,b,
b,b,b,b,b,b,b,b,
b,b,b,b,b,b,b,b,
]

two = [
b,b,b,b,b,b,b,b,
b,g,g,b,b,b,b,b,
b,g,g,b,b,b,b,b,
b,b,b,b,b,b,b,b,
b,b,b,b,b,b,b,b,
b,b,b,b,g,g,b,b,
b,b,b,b,g,g,b,b,
b,b,b,b,b,b,b,b,
]

three = [
g,g,b,b,b,b,b,b,
g,g,b,b,b,b,b,b,
b,b,b,b,b,b,b,b,
b,b,b,g,g,b,b,b,
b,b,b,g,g,b,b,b,
b,b,b,b,b,b,b,b,
b,b,b,b,b,b,g,g,
b,b,b,b,b,b,g,g,
]

four = [
b,b,b,b,b,b,b,b,
b,g,g,b,b,g,g,b,
b,g,g,b,b,g,g,b,
b,b,b,b,b,b,b,b,
b,b,b,b,b,b,b,b,
b,g,g,b,b,g,g,b,
b,g,g,b,b,g,g,b,
b,b,b,b,b,b,b,b,
]

five = [
g,g,b,b,b,b,g,g,
g,g,b,b,b,b,g,g,
b,b,b,b,b,b,b,b,
b,b,b,g,g,b,b,b,
b,b,b,g,g,b,b,b,
b,b,b,b,b,b,b,b,
g,g,b,b,b,b,g,g,
g,g,b,b,b,b,g,g,
]

six = [
r,r,b,b,b,b,r,r,
r,r,b,b,b,b,r,r,
b,b,b,b,b,b,b,b,
r,r,b,b,b,b,r,r,
r,r,b,b,b,b,r,r,
b,b,b,b,b,b,b,b,
r,r,b,b,b,b,r,r,
r,r,b,b,b,b,r,r,
]

def roll_dice():
    r = random.randint(1,6)
    if r == 1:
        sense.set_pixels(one)
    elif r == 2:
        sense.set_pixels(two)
    elif r == 3:
        sense.set_pixels(three)
    elif r == 4:
        sense.set_pixels(four)
    elif r == 5:
        sense.set_pixels(five)
    elif r == 6:
        sense.set_pixels(six)

while True:
    x, y, z = sense.get_accelerometer_raw().values()

    x = abs(x)
    y = abs(y)
    z = abs(z)

    if x > 1.4 or y > 1.4 or z > 1.4:
        roll_dice()
        time.sleep(1)
Posted in Raspberry Pi | Tagged , , | 6 Comments

Spirit level for SenseHAT

Spirit level project

I just got myself an early Christmas present – a SenseHAT for the RaspberryPi. This is the same gizmo Tim Peake will be using on the ISS to run AstroPi experiments designed by school children, so I have the added excitement of having some SPACE HARDWARE on my Pi.

It has a super-bright 8×8 RGB LED matrix, a joystick and various sensors: temperature (limited use as it’s on the board), plus more usefully, sensors for air pressure, humidity, a compass and a gyroscope. It’s really easy to program in Python with the libraries provided by the Raspberry Pi Foundation, and I had text scrolling across the screen within a couple of minutes of plugging it in for the first time.

The gyroscope caught my imagination when I set it up, and my first real project was a simple spirit level. It lights up red when it’s not level, green when horizontal, blue when vertical – and when you put it flat you get a white display with a ‘bubble’ in the middle. It would a great extension to code a ‘bubble’ that moves round the screen as you tilt it.

It’s also powered off a USB battery stick so you can use it in places where the mains don’t reach.

Spirit level project
Not level – red display

Spirit level project
Horizontally level

Spirit level project
Vertically level

Spirit level project
Flat on a level surface

Here’s how it works (though the video doesn’t do justice to the lovely display due to its brightness and strobing:

And here’s the Python code, most of which is taken up with the simple images. Tweaked thanks to David Honess, who pointed out problems with .value() returning things in unexpected orders!

from sense_hat import SenseHat

sense = SenseHat()

r = [255, 0, 0]
g = [0, 255, 0]
b = [0, 0, 255]
w = [255,255,255]
z = [0, 0, 0]

redimage = [
r,r,r,r,r,r,r,r,
r,r,r,r,r,r,r,r,
r,r,r,r,r,r,r,r,
r,r,r,r,r,r,r,r,
r,r,r,r,r,r,r,r,
r,r,r,r,r,r,r,r,
r,r,r,r,r,r,r,r,
r,r,r,r,r,r,r,r,
]

greenimage = [
w,w,w,w,w,w,w,w,
g,g,g,g,g,g,g,g,
g,g,g,g,g,g,g,g,
g,g,g,g,g,g,g,g,
g,g,g,g,g,g,g,g,
g,g,g,g,g,g,g,g,
g,g,g,g,g,g,g,g,
g,g,g,g,g,g,g,g,
]

blueimage = [
w,w,w,w,w,w,w,w,
b,b,b,b,b,b,b,b,
b,b,b,b,b,b,b,b,
b,b,b,b,b,b,b,b,
b,b,b,b,b,b,b,b,
b,b,b,b,b,b,b,b,
b,b,b,b,b,b,b,b,
b,b,b,b,b,b,b,b,
]

whiteimage = [
w,w,w,w,w,w,w,w,
w,w,w,w,w,w,w,w,
w,w,w,w,w,w,w,w,
w,w,w,z,z,w,w,w,
w,w,w,z,z,w,w,w,
w,w,w,w,w,w,w,w,
w,w,w,w,w,w,w,w,
w,w,w,w,w,w,w,w,
]

sense.set_pixels(redimage)

while True:
    raw = sense.accel_raw
    x = raw["x"]
    y = raw["y"]
    z = raw["z"]
    print (x,y,z)

    if (-0.02 < x < 0.02) and (-0.02 < y < 0.02) and (0.98 < z < 1.02):
        sense.set_pixels(whiteimage)
    elif (-0.02 < x < 0.02) and (-0.90 > y > -1.1):
        sense.set_pixels(greenimage)
    elif (-0.02 < y < 0.02) and (-0.90 > x > -1.1):
        sense.set_pixels(blueimage)
    else:
        sense.set_pixels(redimage)

This is the original version of the code, which is unreliable as it reads the variables in a random order:

from sense_hat import SenseHat

sense = SenseHat()

r = [255, 0, 0]
g = [0, 255, 0]
b = [0, 0, 255]
w = [255,255,255]
z = [0, 0, 0]

redimage = [
r,r,r,r,r,r,r,r,
r,r,r,r,r,r,r,r,
r,r,r,r,r,r,r,r,
r,r,r,r,r,r,r,r,
r,r,r,r,r,r,r,r,
r,r,r,r,r,r,r,r,
r,r,r,r,r,r,r,r,
r,r,r,r,r,r,r,r,
]

greenimage = [
w,w,w,w,w,w,w,w,
g,g,g,g,g,g,g,g,
g,g,g,g,g,g,g,g,
g,g,g,g,g,g,g,g,
g,g,g,g,g,g,g,g,
g,g,g,g,g,g,g,g,
g,g,g,g,g,g,g,g,
g,g,g,g,g,g,g,g,
]

blueimage = [
w,w,w,w,w,w,w,w,
b,b,b,b,b,b,b,b,
b,b,b,b,b,b,b,b,
b,b,b,b,b,b,b,b,
b,b,b,b,b,b,b,b,
b,b,b,b,b,b,b,b,
b,b,b,b,b,b,b,b,
b,b,b,b,b,b,b,b,
]

whiteimage = [
w,w,w,w,w,w,w,w,
w,w,w,w,w,w,w,w,
w,w,w,w,w,w,w,w,
w,w,w,z,z,w,w,w,
w,w,w,z,z,w,w,w,
w,w,w,w,w,w,w,w,
w,w,w,w,w,w,w,w,
w,w,w,w,w,w,w,w,
]

sense.set_pixels(redimage)

while True:
    pitch, roll, yaw = sense.get_orientation().values()
#   print (pitch, roll, yaw)
    if (pitch < 3 or pitch > 355) and (yaw < 3 or yaw > 355):
        sense.set_pixels(whiteimage)
    elif pitch < 0.5 or pitch > 359.5:
        sense.set_pixels(greenimage)
    elif yaw < 5 or yaw > 355:
        sense.set_pixels(blueimage)
    else:
        sense.set_pixels(redimage)
Posted in operating systems, Raspberry Pi | Tagged , , | Leave a comment