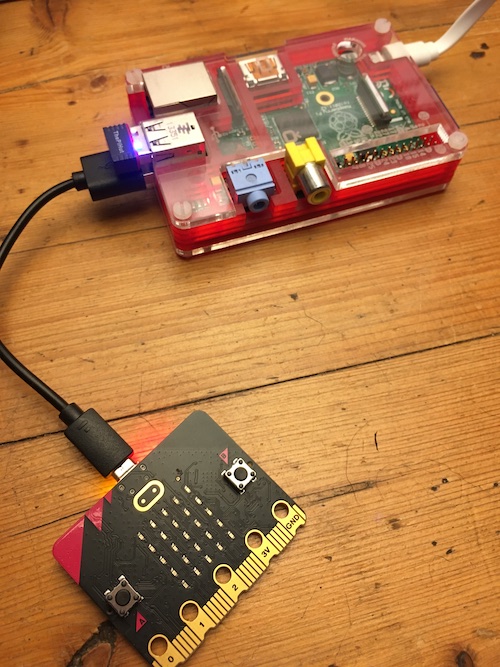
Using a BBC micro:bit, an old Raspberry Pi and a surprisingly small amount of code, you can log sensor data in a simple CSV (comma separated values) text file and plot it on an interactive graph you can access from any device on your local network.
Of course, you can connect sensors direct to a Raspberry Pi, but using a micro:bit means it’s easy to code and it gives you access to all its built-in sensors: temperature, light, 3 dimensional accelerometer and magnetometer and sound on the micro:bit V2. Even if you don’t have access to an external temperature sensor, as I explain in the video above, the micro:bit’s on-board temperature sensor is still useful for measuring temperature changes over time.
The micro:bit also has a beautifully simple radio protocol, so you could collect data from micro:bits in other rooms and outside, collate the data on a micro:bit connected to a Raspberry Pi just using a USB cable, and plot it all on a single graph or dashboard.
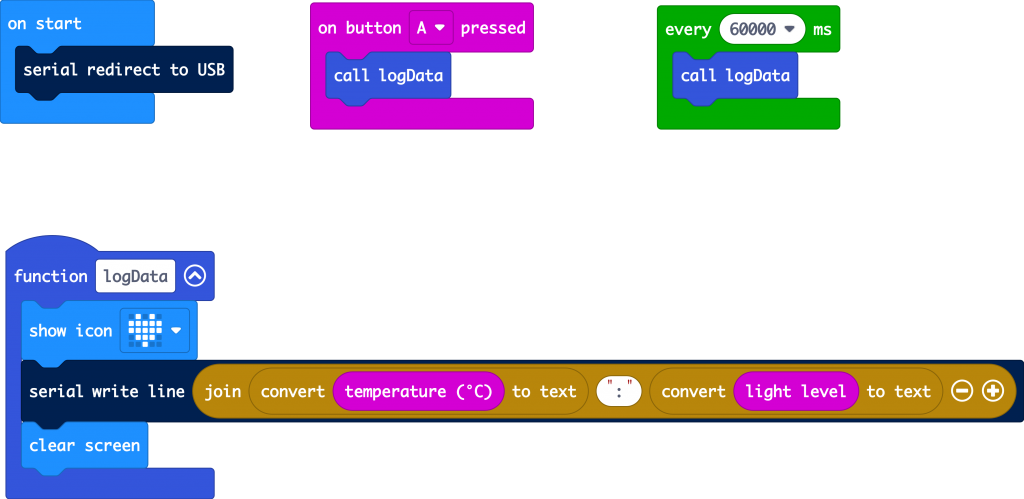
Here’s how it works. I used a simple MakeCode program on the micro:bit to send sensor data in a string as serial data over USB to the Raspberry Pi. The two values are separated by a colon:
Over on the Raspberry Pi, a Python program polls the USB port once a second. When it gets some data, it splits the numbers and logs them with a short timestamp to a CSV file.
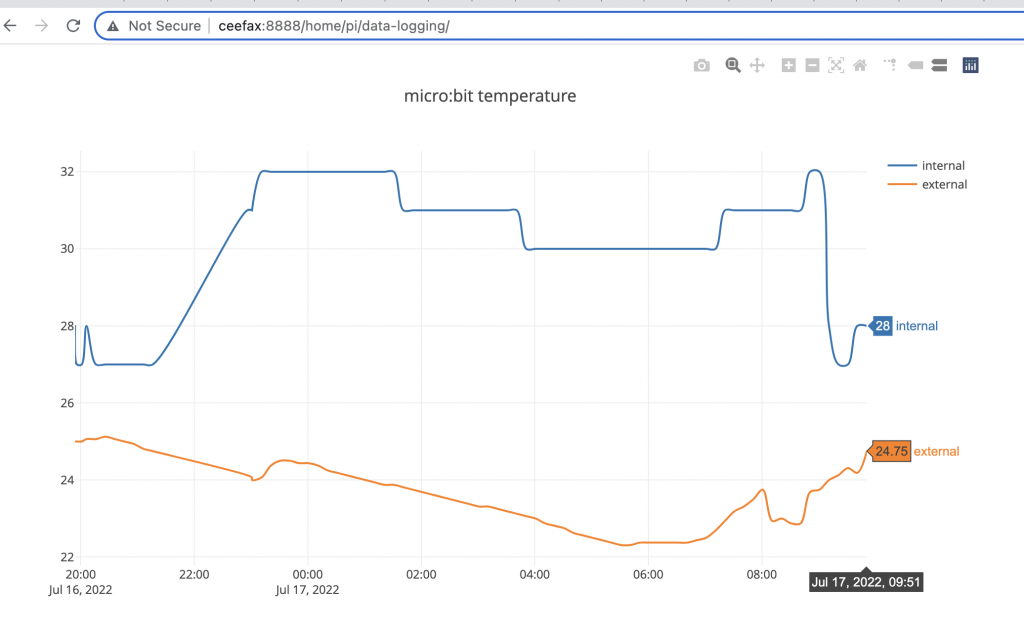
An HTML file uses the Plotly JavaScript library to read the CSV file and turn it into an interactive graph:
The graph is then served up on a web page on your local network using a simple built-in Python web server.
You can test out a sample graph here: http://suppertime.co.uk/microbit/data/
And you can get all the code you need and more detailed build instructions over on my Github: https://github.com/blogmywiki/microbit-pi-data
All you need is a BBC micro:bit and an old Raspberry Pi!
Update – long term use
After around 4 days’ use, logging data every 10 minutes, this system failed. I think the SD card got corrupted. So, for long term use you’d need to find another solution. Perhaps use a RAM disk and send the CSV file somewhere by FTP. Or use external USB storage, although that’s not an option with this set-up with a very old Pi as both USB ports are in use, one for Wi-Fi and one for talking to the micro:bit. It would be possible to use serial communication between the micro:bit and the Pi, for example, but I like the simplicity of USB.
Also when trying to fix this, I could not get my USB Wi-Fi dongles working with Raspberry Pi OS Bullseye Lite. I had previously been using Buster.
micro:bit data logging feature
If don’t have a Raspberry Pi to hand, but you do have a micro:bit V2, you can use it on its own to log data that stays on the micro:bit when the power is disconnected, and which you can view direct from the micro:bit in an interactive graph and table. Find out more here: https://microbit.org/get-started/user-guide/data-logging/. You can also view a sample set of data collected on a micro:bit here – it’s the data set I used comparing readings from the micro:bit’s onboard temperature sensor with a more granular external temperature probe – click on ‘visual preview’ to see the interactive graph. It’s easy to copy and paste data into a spreadsheet and export the data as a CSV file.


