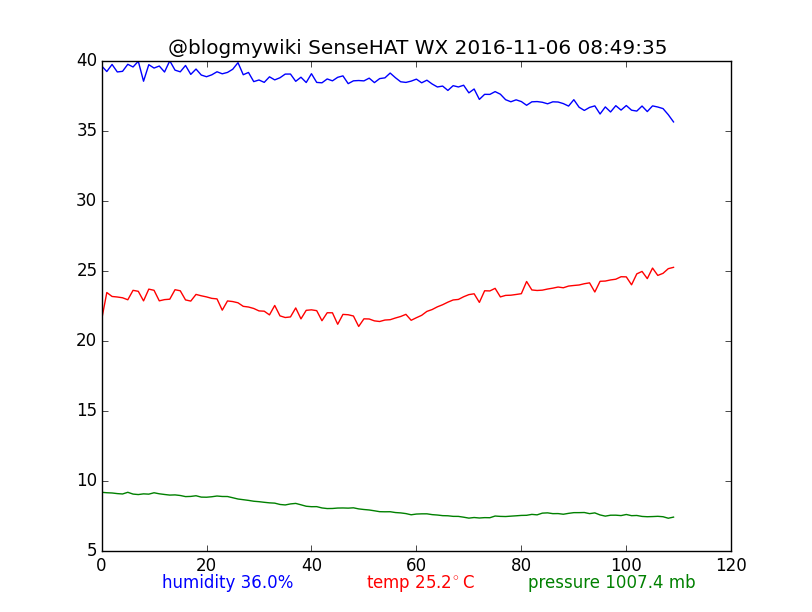
Chart showing the weather in my lounge overnight! Can you spot when the central heating came on? Also note the correlation between temperature and humidity. Numbers refer to blocks of 5 minutes.
I previously blogged about some very simple Python you can use to do to live data logging and graphing of environmental factors like air pressure, humidity and (sort of) temperature using the Raspberry Pi computer and a SenseHAT module.
Well, the project’s evolved a bit over the last day or so and this 4th iteration is becoming more like a weather station. I know this is not an original idea, but I wanted to have a go at writing all the code myself as I want to build a weather station in my school and this would be a good ‘proof of concept’ project. Ideally I’d like the pupils to design as much as possible, this could be used to show them the kinds of things you can do with snap-together parts and relatively few lines of code.
This version still draws a live(ish) chart on the Pi’s screen but now…
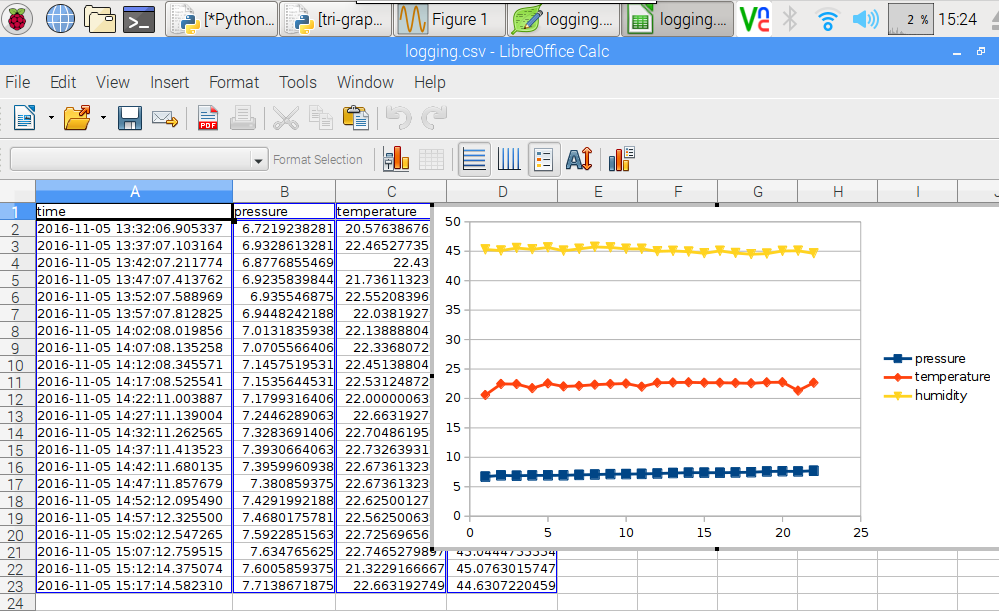
- It logs readings to a time-stamped CSV file – this means you can analyse the data later using a spreadsheet program or similar.
- It saves a PNG image file of the chart which it then sends by FTP – for example, to update a chart on a web site.
- The chart displays the current readings at the bottom and timestamps the title
 Drawing charts from the saved CSV file using a spreadsheet is easy. This is using LibreOffice on the Pi itself but you could also use Microsoft Excel or Apple Numbers.
There’s much to do with this still. It keeps drawing the graph over bigger and bigger timescales, and I I guess it will eventually run out of memory as the list gets too long, so I need to sort that out. And it would be nice to also FTP the CSV file, include some daily high/low information, have proper time stamps on the chart, make use of the SenseHAT’s LED display/buttons in some way and make it run headless.
I also need to do some tests to see how accurate the temperature fudge might be – perhaps I should also log the SenseHAT’s temperature data as well as the estimated ambient temperature?
Here’s the code. It needs to run in Python 3, a connected SenseHAT and the matplotlib Python library installing.
# v4 FTPs chart to remote web server
# v3 this adds real timestamping and logging to a CSV file
import matplotlib.pyplot as plt
from time import sleep
from sense_hat import SenseHat
import time
from datetime import datetime
import os

import ftplib

def getCPUtemperature():
 res = os.popen('vcgencmd measure_temp').readline()
 return(res.replace("temp=","").replace("'C\n",""))

sense = SenseHat()
plt.ion()
pressure_list = []
temp_list = []
humidity_list = []
x = []
a = 0
# uncomment these lines to write headers to CSV file
#fd = open('logging.csv','a')
#fd.write('time,pressure,temperature,humidity\n')
#fd.close()

while True:
    fd = open('logging.csv','a')
    pressure = sense.get_pressure()-1000
    pressure_list.append(pressure)
# attempt to calculate ambient temperature
# based on dgaust in https://www.raspberrypi.org/forums/viewtopic.php?f=104&t=111457
    cpuTemp=int(float(getCPUtemperature()))
    ambient = sense.get_temperature_from_pressure()
    calctemp = ambient - ((cpuTemp - ambient)/ 1.5)
    temp_list.append(calctemp)

    humidity = sense.get_humidity()
    humidity_list.append(humidity)

    timestamp = str(datetime.now().strftime('%Y-%m-%d %H:%M:%S'))
    fd.write(timestamp+','+str(pressure)+','+str(calctemp)+','+str(humidity)+'\n')
    fd.close()
    print(timestamp, pressure, calctemp, humidity)

    x.append(a)
    a = a + 1

    plt.clf()
    plt.plot(x,humidity_list)
    plt.plot(x,temp_list,'r')
    plt.plot(x,pressure_list,'g')
    plt.title('@blogmywiki SenseHAT WX '+timestamp)
    plt.figtext(0.2, 0.04, "humidity "+str(round(humidity,0))+"%",color='blue')
    plt.figtext(0.45, 0.04, "temp "+str(round(calctemp,1))+"$^\circ$C",color='red')
    plt.figtext(0.65, 0.04, "pressure "+str(round(pressure,1)+1000)+" mb",color='green')
    plt.savefig('wx_chart.png')
    plt.draw()

    try:
        session = ftplib.FTP('FTP-ADDRESS-HERE','FTP-USERNAME','FTP-PASSWORD')
        file = open('/home/pi/Desktop/wx_chart.png','rb')           # file to send
        session.storbinary('STOR WEB-SERVER-PATH-HERE/wx_chart.png', file)     # send the file
        file.close()                                                # close file and FTP
        session.quit()
    except ftplib.all_errors as e:
        print(e)

    sleep(300)
UPDATE – I’ve got a new version here that runs headless and shows max/min data.
