This week I did a maths investigation I recall doing myself when I was at primary school – and that was a long time ago! It’s the one where you find out which total scores, if any, are more likely when you roll 2 dice.
My modern twist was to combine this with a Computer Science lesson and some Scratch programming. You could do this in almost any KS2 class I think, with varying amounts of support.
I asked what we’d expect to find if we roll one die – most assumed we’d get a fairly even spread of numbers, though some thought 6 would be less likely. We soon found great variation, some groups never rolled a 5, another group rolled 1 way more than any other number. We had a discussion about why this might be – were our dice rolls really fair? Generally, though, we agreed the probability of getting any particular score from 1 to 6 was… 1 in 6. How could we get better results? By rolling the die more often! It was getting a bit tedious, though…
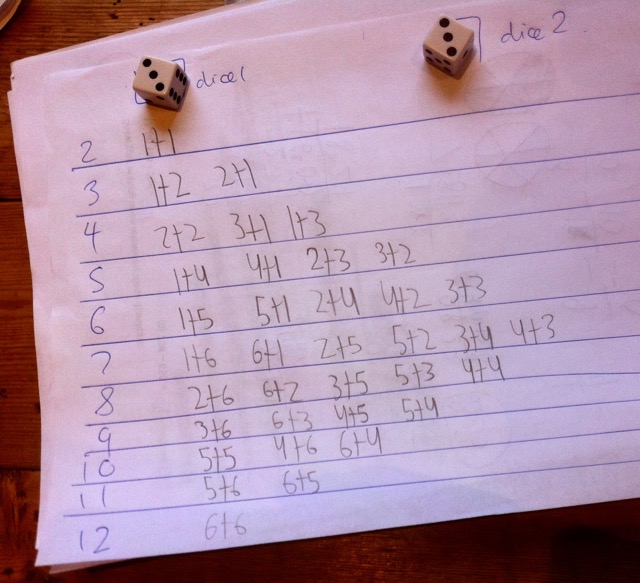
We then tried rolling 2 dice, added them and tallied how many of each possible score from 2 to 12 we got. We soon found that 6, 7 and 8 seemed to crop up more than any other number. To find out why that might be we wrote out every possible way of making each total:
Now it’s clear that there are more ways of making 7 than any other number.
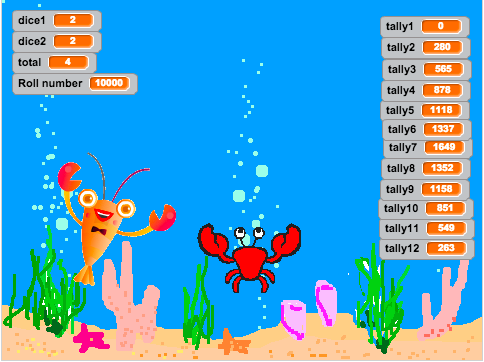
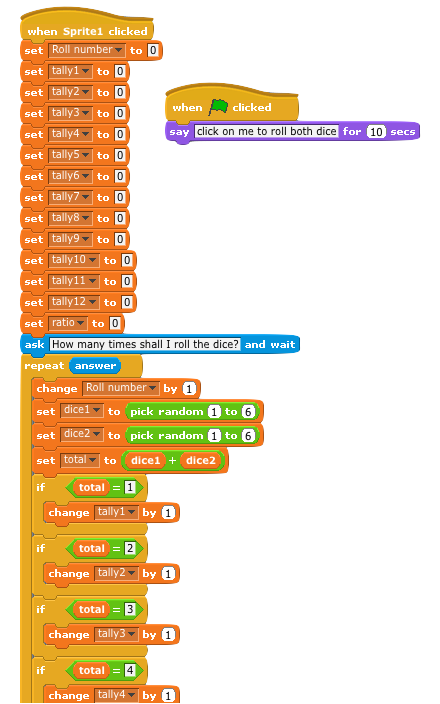
To prove this we then used a Scratch project I made (though with more time I’d get the pupils to make it themselves). We used it to simulate 10,000 dice rolls!
(Embedded Scratch project below requires Flash)
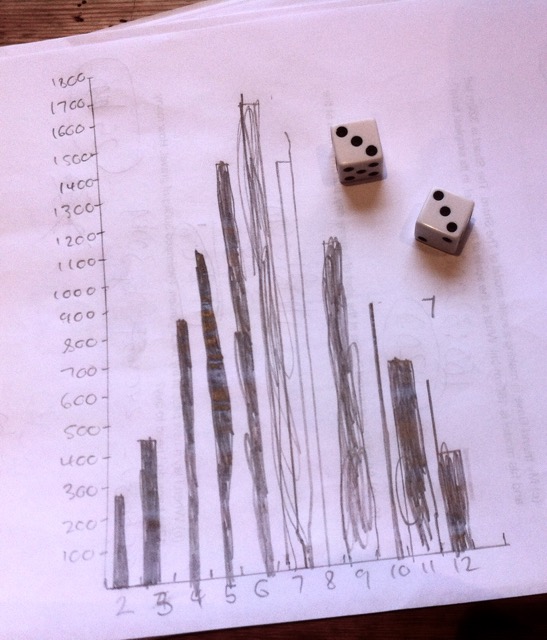
We drew rough and ready bar charts on scrap paper to record our findings – and saw that the distribution spookily mirrored the chart we made of the possible ways of making each total:
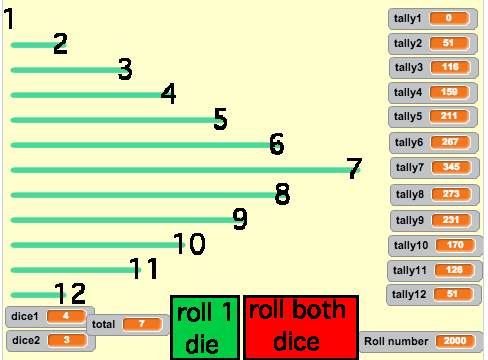
I’ve since tweaked the Scratch project so it actually plots bar charts using turtle graphics. Click the green flag to reset, then choose if you want to roll 1 or 2 dice. This works well with up to about 2000 throws.
(Embedded Scratch project below requires Flash)
There are loads of ways of extending this. Can you work out what the ratio is of the number of 7s you make and the total number of throws? You’ll find that the more rolls you do, the closer this approaches a certain ratio. What is it? Why is this? Could the gifted coders in the class remix the project so that it scales the bar charts to fit the screen depending on how many throws you make?
If you use this activity or remix the Scratch project, let me know! It’s a Scratch version 1.4 project for maximum compatibly and Raspberry Pi-friendliness. Here’s a chunk of the lobster’s code blocks:

